
Mapboot Analytics for Attendee Discovery
See how Mapboot analytics reveal attendee discovery, exhibitor visibility, map search behavior, and route intent inside an interactive event map.
What Map Data Reveals During a Trade Show
That is where Mapboot can be useful. Search behavior, no-result queries, exhibitor discovery, and route requests can all reveal what attendees cared about before they ever reached a booth.
This article is a practical look at how that information can help organizers improve the map experience, support exhibitors, and make better decisions for future shows.
Most event teams already collect a lot of data. They know how many people registered, how many checked in, which exhibitors bought space, which sponsors paid for visibility, and sometimes which sessions attracted the most interest.
But there is one part of the event experience that is still surprisingly hard to understand:
What are attendees trying to find once they are inside the show environment?
That question matters because the floor plan is not just a layout. It is where discovery actually happens. It is where an attendee decides which booth to visit, which category to explore, which sponsor to notice, and which part of the show feels relevant to them. Mapboot analytics are built around that idea. The goal is not to create another dashboard full of vanity numbers. The goal is to help organizers understand how people search, discover, and move through the Mapboot event map. If you are still earlier in the process, start with the practical guide to launching an interactive trade show floor plan. If exhibitor visibility is the main concern, the companion article on interactive floor plans and exhibitor discovery explains why this data matters before analytics enter the conversation.
Mapboot turns the trade show map into a discovery layer
For a long time, trade show maps were treated as static assets. A floor plan was uploaded as a PDF, embedded into a website, printed on signage, or placed inside an event app. It helped people understand the general layout, but it did not say much about what visitors actually wanted. A searchable, browser-based map changes that, especially when the map is part of the attendee journey instead of an afterthought. When attendees use the map to search for exhibitors, product types, categories, brands, or activities, every interaction becomes a small signal. Not in a creepy way. Not as personal tracking. Just as aggregated behavior that helps the event team understand demand.
For example, there is a big difference between knowing that 10,000 people attended a show and knowing that many of them searched for terms like:
- electric vehicles
- robotics
- packaging automation
- AI inspection
- Italian cars
- food processing equipment
- startup pavilion
Those searches reveal intent. They show what attendees came looking for, not just where they happened to walk. That is the layer Mapboot is trying to make visible for trade show organizers, sponsors, and exhibitors.
Global discovery performance in Mapboot
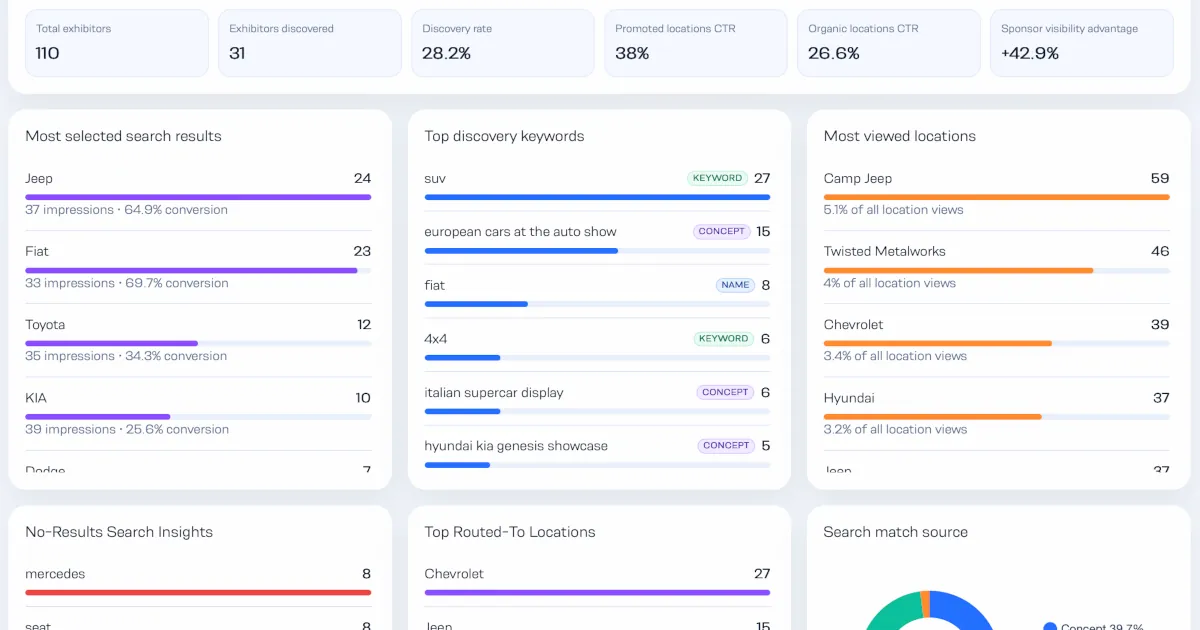
The first level of analytics is the overall health of discovery across the event. This includes metrics such as total exhibitors, exhibitors discovered, discovery rate, promoted location performance, organic location performance, and sponsor visibility advantage.
These numbers help answer simple but important questions:
Are attendees actually discovering exhibitors through the map? Are promoted locations receiving more attention than organic locations? Is the floor plan helping visitors find a wider range of exhibitors, or are only the obvious names getting attention?
For organizers, this is useful because exhibitor value is not only about booth placement. It is also about whether attendees can find them when they search for relevant products, services, categories, or ideas. A booth in a good location can still be under-discovered if the attendee does not know what to search for. A smaller exhibitor can receive more visibility if their profile, keywords, and category placement match real visitor intent. That is where discovery analytics become more useful than basic view counts.
Mapboot search results show what people actually select
One of the most useful Mapboot analytics sections is the list of most selected search results. This is different from simply tracking what people type. A search term tells you what someone wanted. A selected result tells you what they chose after seeing the options. That distinction matters. Imagine an attendee searches for “EV charging” and sees five exhibitors. If they repeatedly select one exhibitor over the others, that may indicate stronger relevance, better naming, better metadata, stronger brand recognition, or simply a clearer result. Mapboot tracks this behavior so organizers can understand which exhibitors are being discovered through search and how often those search impressions convert into clicks or selections.
This helps answer questions like:
- Which exhibitors are getting attention from map search?
- Which search results appear often but are not selected?
- Which exhibitors may need better descriptions, categories, or keywords?
- Which sponsors are getting meaningful discovery instead of just logo exposure?
For exhibitors, this can become a very practical reporting layer. Instead of only saying “your booth was on the map,” the organizer can show whether visitors actually found and selected that exhibitor through the digital floor plan.
Discovery keywords reveal attendee intent
Search keywords are one of the clearest signals inside an event map. They show what attendees are actively looking for in their own words. Mapboot separates different kinds of matches, such as exact location names, keywords, descriptions, and broader concept matches. This matters because not every attendee searches the same way. Some people search by company name. Some search by product category. Some search by a problem they are trying to solve. Some type loose concepts that do not perfectly match the exhibitor database. For example, an attendee might not search for a specific exhibitor. They might search for something like “korean ev and suv lineup,” “italian supercar display,” or “industrial vision systems.” That kind of search is valuable because it reveals the attendee’s mental model. They are not thinking like a database. They are thinking like a visitor. Mapboot analytics help surface those patterns so event teams can understand the language attendees are actually using inside the trade show floor plan.
That information can improve many parts of the event:
- exhibitor metadata
- category naming
- sponsor packages
- website content
- on-site signage
- future floor planning
- attendee communication before the event
The most useful keywords are not always the cleanest ones. Sometimes the messy searches are the most honest ones.
No-result searches may be the most valuable Mapboot signals
No-result searches are easy to ignore, but they can be some of the most important analytics in the entire map. A no-result search means an attendee looked for something and the Mapboot search experience could not return a useful match. That can happen for several reasons. Maybe the exhibitor exists, but the profile is missing the right keyword. Maybe the event has companies in that category, but the category name is different from what attendees use. Maybe the search term points to a real demand that the event does not currently serve. Or maybe the attendee misspelled something. In all cases, the signal is useful. No-result searches help organizers identify friction in the discovery experience. They show where visitors are trying to go but hitting a dead end. For example, if many attendees search for a brand that is not exhibiting, that may be a sales opportunity for the next edition of the event. If people search for a category that exists but does not return results, the issue may be content structure. If people search for common variations of product names, exhibitors may need better keyword coverage. This is where analytics become operational. The goal is not just to observe the problem. The goal is to fix the map while the event is still live, or use the data to improve the next edition.
Most viewed locations show where attention is going
Location views are simple, but they are still useful. They show which booths, zones, activations, or areas are receiving attention inside the map. This can help organizers compare digital interest with physical expectations.
For example:
- Are the most viewed locations also the largest sponsors?
- Are visitors opening exhibitor profiles before asking for directions?
- Are certain categories receiving more map attention than expected?
- Are some high-value exhibitors not receiving enough visibility?
Viewed locations can also help validate sponsorship placement. If a sponsor is promoted inside the map, the organizer can measure whether that visibility led to more opens, searches, or route requests. That is a stronger story than simply saying the sponsor was displayed. It shows whether the sponsor was discovered.
Route requests show stronger attendee intent
A location open is a sign of interest. A route request is usually stronger. When on attendee asks for directions to a booth or area, they are closer to taking action. They are not just browsing. They are likely trying to visit. Mapboot tracks routed-to locations so organizers can understand which exhibitors or areas are creating movement inside the event. This is especially important for large shows, where the difference between being viewed and being visited can be meaningful. An exhibitor may receive many profile opens but fewer route requests. That could mean attendees were curious but not motivated enough to visit. Another exhibitor may receive fewer opens but a higher number of direction requests, which may suggest stronger intent. For organizers, this gives a better view of the relationship between discovery and movement. For exhibitors, it creates a more useful visibility report. They can see not only whether people found them, but whether those visitors took the next step. If you are also comparing platforms, our related guide on Mapboot vs Map Your Show breaks down how attendee experience and map workflow differ in practice.
Why Mapboot analytics matter for exhibitors
Exhibitors spend money to be present at an event, but many of them still have limited visibility into how visitors discover them before reaching the booth. Lead scans tell one part of the story. Booth traffic tells another. But there is often a missing layer between attendee interest and physical engagement. Mapboot analytics help fill that gap by showing how discovery happens before booth staff ever meet the visitor. An exhibitor can learn whether people searched for their company, whether they were discovered through product terms, whether attendees opened their profile, whether visitors requested directions, and which keywords led people to them. That does not replace lead retrieval. It complements it. Lead retrieval captures people who made it to the booth. Map analytics can show the discovery activity that happened before that moment. For exhibitors, that can be valuable because it shows demand even when a visitor does not complete a lead scan. It can also reveal missed opportunities, such as high search impressions but low conversion. That kind of insight helps exhibitors improve their content, booth positioning, and event strategy. That connects directly to the discovery problem covered in how interactive floor plans help exhibitors get discovered: analytics are most useful when the map is already helping attendees find relevant companies.
Why Mapboot analytics matter for organizers
For organizers, the bigger value is understanding the event floor as a living environment. A static floor plan cannot tell you where attendees struggled. It cannot show which categories attracted attention. It cannot explain why certain exhibitors were discovered more than others. It cannot reveal which searches returned no useful result. A searchable map can. That gives organizers a better way to evaluate the event experience. They can see what attendees wanted, where discovery worked, where it failed, and which exhibitors or sponsors benefited from map visibility. This can support better decisions before, during, and after the event. Before the event, analytics from previous editions can help with sales, layout planning, category structure, and sponsor packaging. During the event, search and no-result data can help identify content gaps that may be fixed quickly. After the event, discovery reports can help organizers tell a stronger story to exhibitors and sponsors. That is the real point of Mapboot analytics: turning map activity into decisions.
Mapboot analytics should be readable, not overwhelming
One problem with many dashboards is that they show a lot but explain very little. Mapboot analytics are meant to stay readable. The goal is for an event team to quickly understand what is happening without needing a data analyst to decode every chart. That is why the dashboard focuses on practical questions:
- What are attendees searching for?
- Which exhibitors are being discovered?
- Which locations are getting opened or routed to?
- Which searches are producing no results?
- Are promoted locations outperforming organic locations?
- Which keywords led visitors to each booth?
- How are people finding locations: exact name, keyword, description, or concept?
These are questions an organizer can actually use. The dashboard should not feel like a report built for reporting’s sake. It should feel like a tool that helps the team improve discovery, exhibitor visibility, and trade show map usability.
A better map creates a better feedback loop
The most important thing about Mapboot analytics is the feedback loop. Attendees use the map because they need to find something. Their searches and clicks reveal what they care about. Organizers use that information to improve the map, support exhibitors, strengthen sponsor value, and plan better future editions. Then the next event becomes easier to explore. That is the difference between a floor plan that simply displays space and a floor plan that helps the event learn from itself. Mapboot is built around that idea. The interactive map is not only a front-end experience for attendees. It is also a feedback system for the organizing team. A modern event map should not only help people get around. It should help organizers understand what people are trying to discover.
Final thought
Analytics are only useful when they connect to real decisions. For trade shows and exhibitions, the decisions are clear: how to improve attendee discovery, how to give exhibitors better visibility, how to make sponsor value easier to prove, and how to understand what visitors actually want from the show floor. That is where Mapboot analytics can help most. They turn the floor plan from a static reference into a measurable discovery layer. And for large events, that can make the map one of the most useful sources of insight the organizer has. If you want the broader product context behind these analytics, read Mapboot vs Map Your Show: Which One Fits Your Event Better?.